Academic English II (AE2) - Fall 2018, Kawamoto
LECTURE NOTES
Data Tables
Calculating the mean ( ) and standard deviation (SD, ) and standard deviation (SD,  ) of a set of data
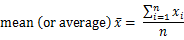
The mean is the average value of a group of data.
The formula is: ) of a set of data
The mean is the average value of a group of data.
The formula is:
 For example, if we consider the following data set:
the number of samples (n) is 6
the mean is
= (10 + 8 + 10 + 8 + 8 + 4) / 6
= 8
We can judge how far the data samples are spread around the
mean value by calculating the variance and standard deviation
(SD, ) of the data set as follows:
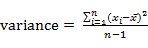
 A standard deviation value close to 0 means the data samples are
grouped very close to the mean.
For the sample data set above, the variance of the data set is
A standard deviation value close to 0 means the data samples are
grouped very close to the mean.
For the sample data set above, the variance of the data set is
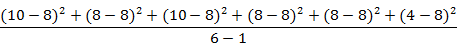 or 4.8. The standard deviation is
 or 2.19. In this example, 5 out of 6 (83%) of the data samples are within
one standard deviation from the mean.
Note: Usually at least 68% of all the samples will fall inside one standard
deviation (higher or lower) from the mean. Approximately 95% of the data
will fall within two standard deviations from the mean.
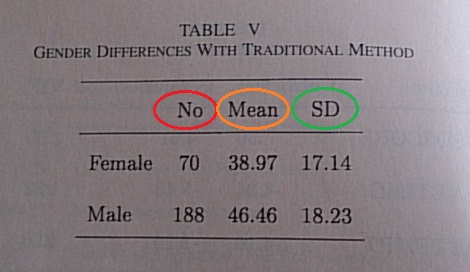
Samples of tables with number of samples (n), mean, standard deviation
information:
or 2.19. In this example, 5 out of 6 (83%) of the data samples are within
one standard deviation from the mean.
Note: Usually at least 68% of all the samples will fall inside one standard
deviation (higher or lower) from the mean. Approximately 95% of the data
will fall within two standard deviations from the mean.
Samples of tables with number of samples (n), mean, standard deviation
information:
 Click on image for larger view
 Click on image for larger view
.jpg) Click on image for larger view
Click on image for larger view

|


